Description
Caveats:
This excellent dashboard was developed in the SCCM 2007 days, so be kind to this old dog.
Yes, the dashboard uses Microsoft Silverlight.
The dashboard is a .NET application that runs an HTML file within an embedded web browser control.
HTML uses a lot of Javascript libraries to render the charts. Javascript in the pre-HTML5 days does not use ‘worker threads’, so the dashboard might not be quick to respond. The dashboard might crash or time-out if your database is cluttered or too big. This has not happened to us, but there is a possibility.
The dashboard requires a direct connection to the SCCM SQL database. The dashboard user needs at least read access with the ‘Select’ permissions.
Having said all that, this dashboard has served our Customers and us well for over a decade. The dashboard displays information in the SCCM database and visually paints a picture from 6 different views.
Some of our other products
Deploy desktop wallpaper backgrounds as MSI to local and Cloud connected devices. Click here.
Task Sequence UI for enterprise SOE deployment. Click here.
Monthly software update compliance reporting using SSRS reporting. Click here.
Let’s talk about the free dashboard and the different views through which compliance is reported.
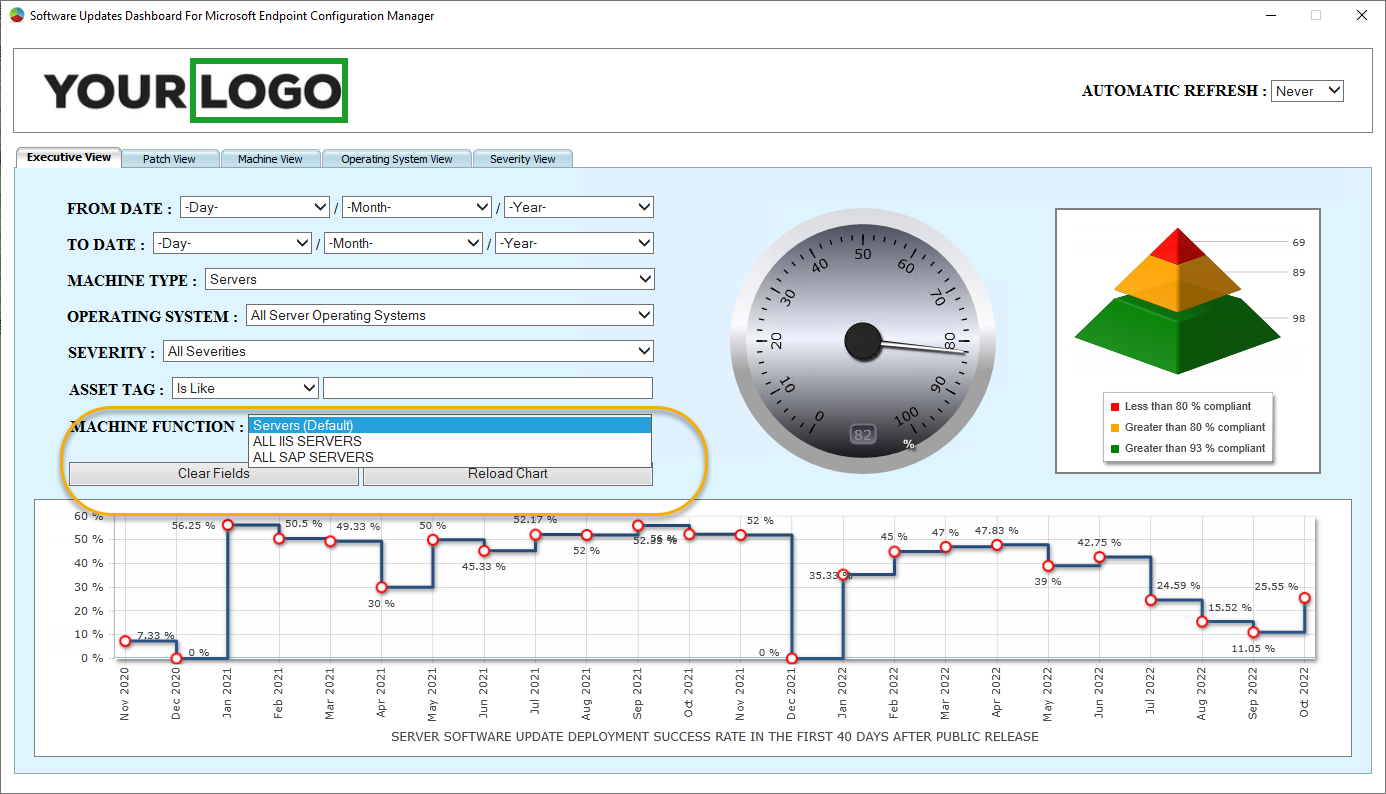
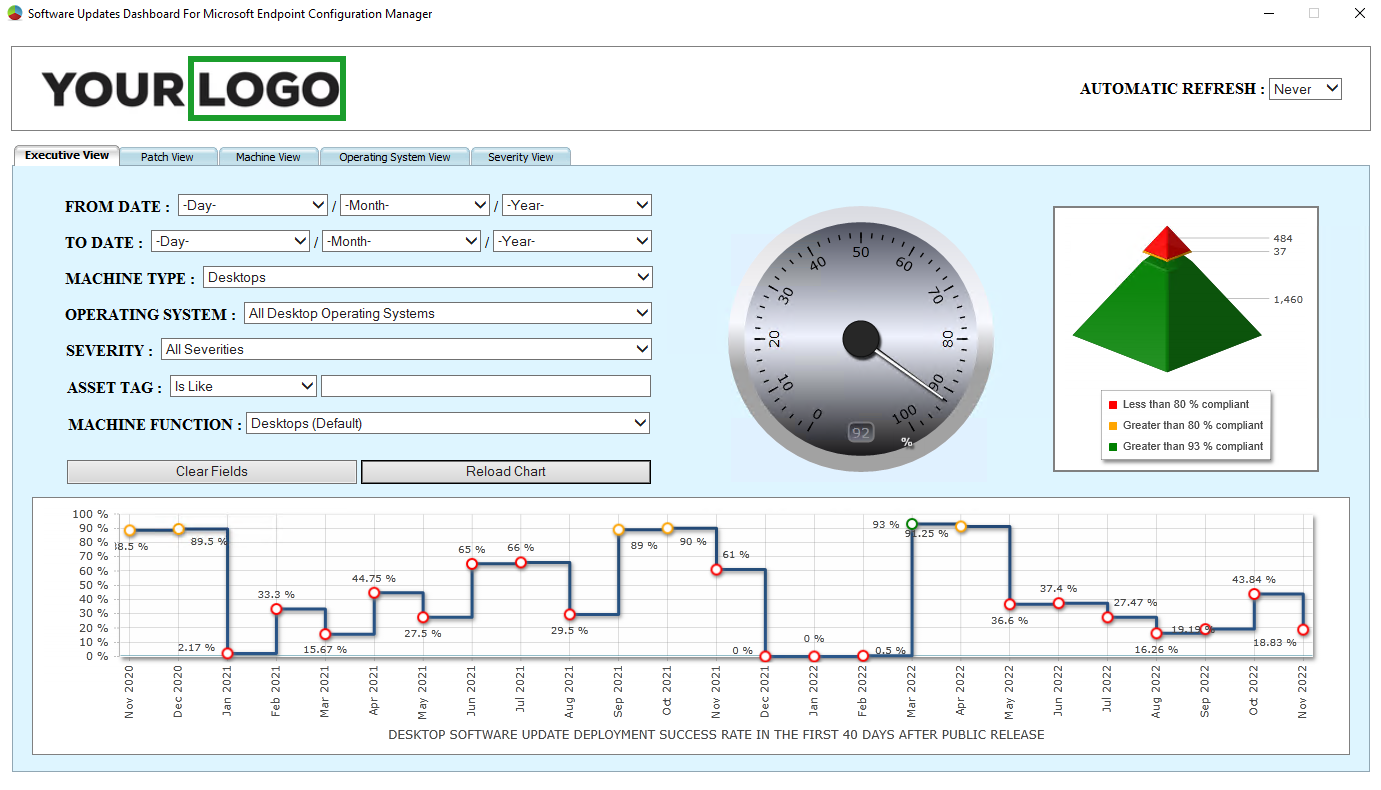
Executive view (1) and deployment rate view (2):
The executive view gives the organisation’s overall compliance figures. It also provides a breakdown of machines with compliance less than 80% [Red], greater than 80% [Yellow] and greater than 93% [Green]. The thresholds are set in the configuration file (discussed later in this article).
The chart at the bottom of the below image displays the monthly software update deployment success rate within the first 40 days after the patch has been publicly released. The thresholds (40, 60 etc.) are set in the configuration file (discussed later in this article).
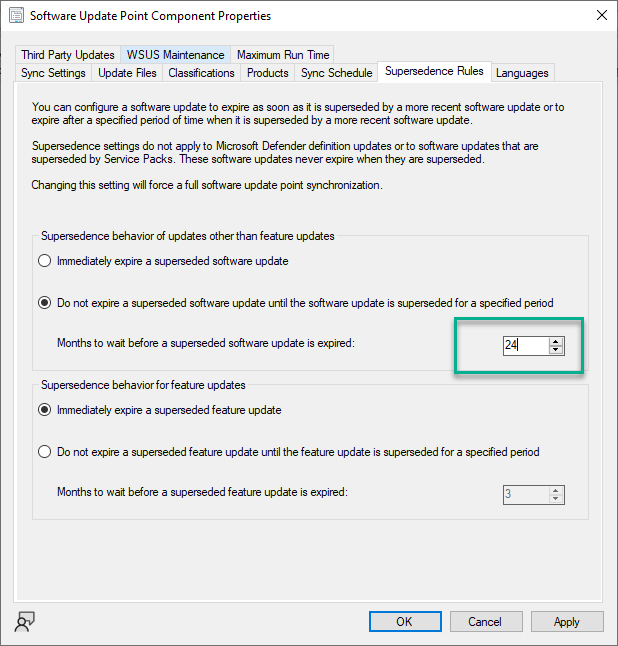
The above ‘compliance rate’ chart includes ‘Superseded updates’ that were deployed for that month. It’s essential to configure SCCM to hold on to ‘Superseded updates’ for 24 months.
If ‘Superseded updates’ are ‘Expired’ within that timeframe, you would lose the ability to measure deployment saturation rates after a ‘Superseded update’ has been ‘Expired.’
Doing so will increase storage requirements. But I believe it’s worth the tradeoff. Nowadays, storage costs are a dime a dozen.
This setting is found under the “\Administration\Overview\Site Configuration\Sites”. Click on the “Configure site components” button on the top ribbon and then click on “Software Update Point”, and then choose the “Supersedence rules” tab.
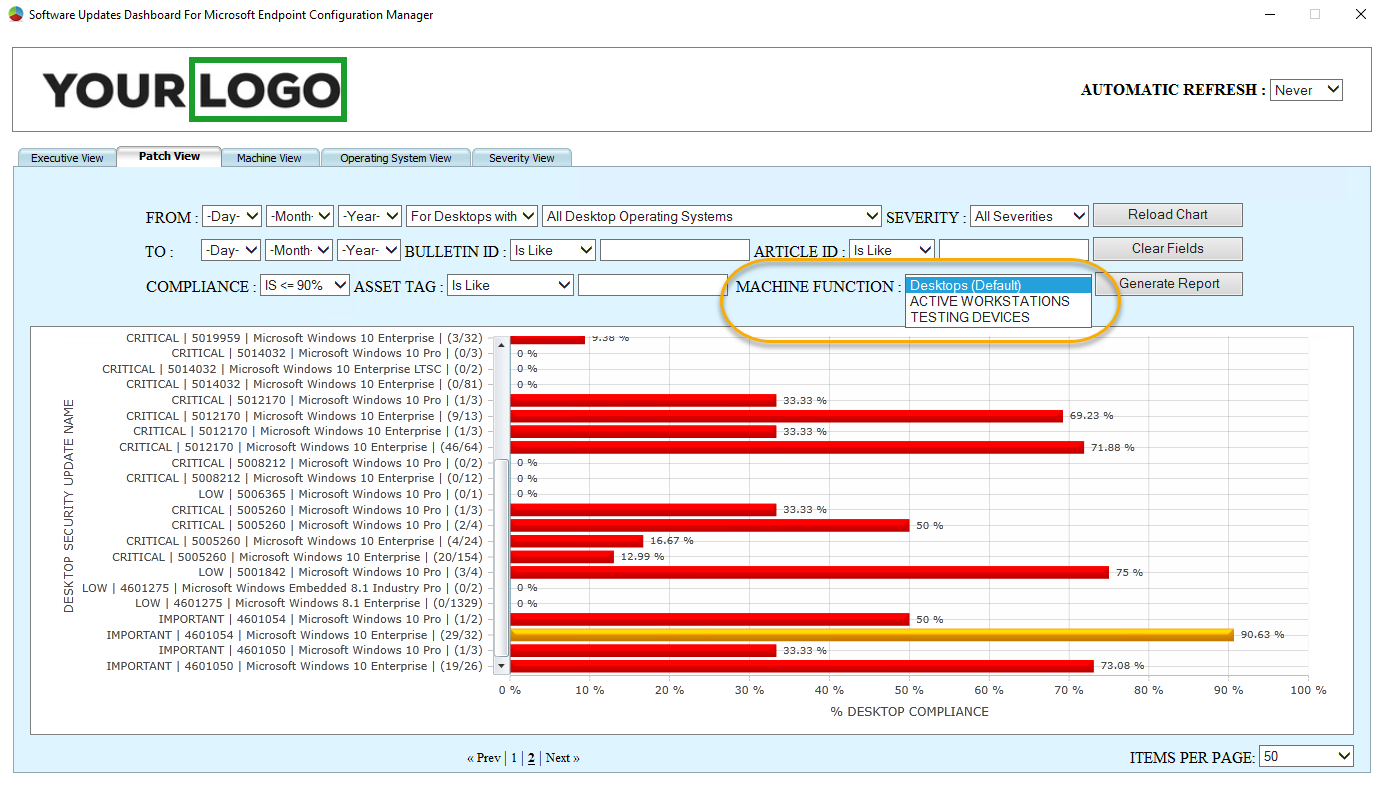
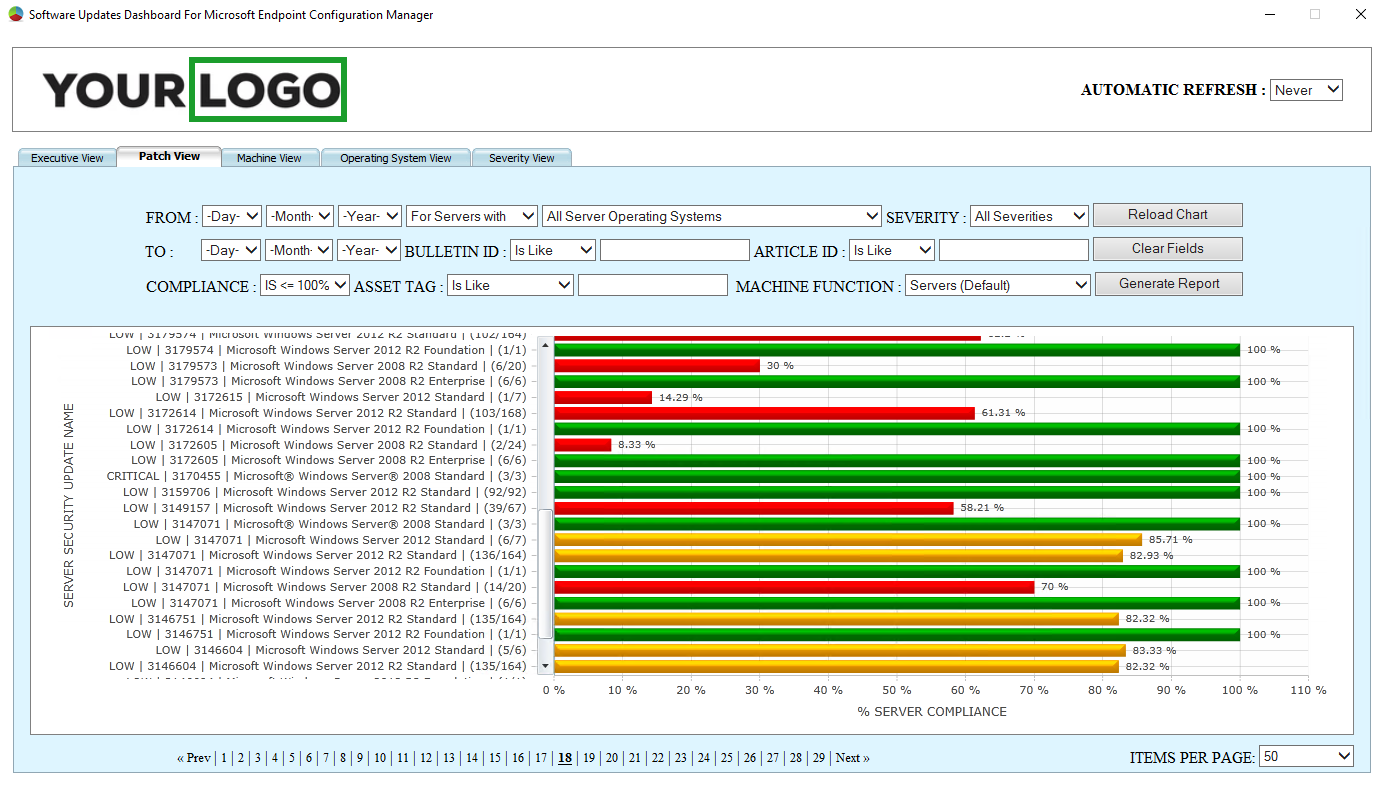
Patch View (3) :
Compliance reporting from the perspective of individual security updates. The dashboard also can drill down into each element and list all the compliant and non-compliant machines.
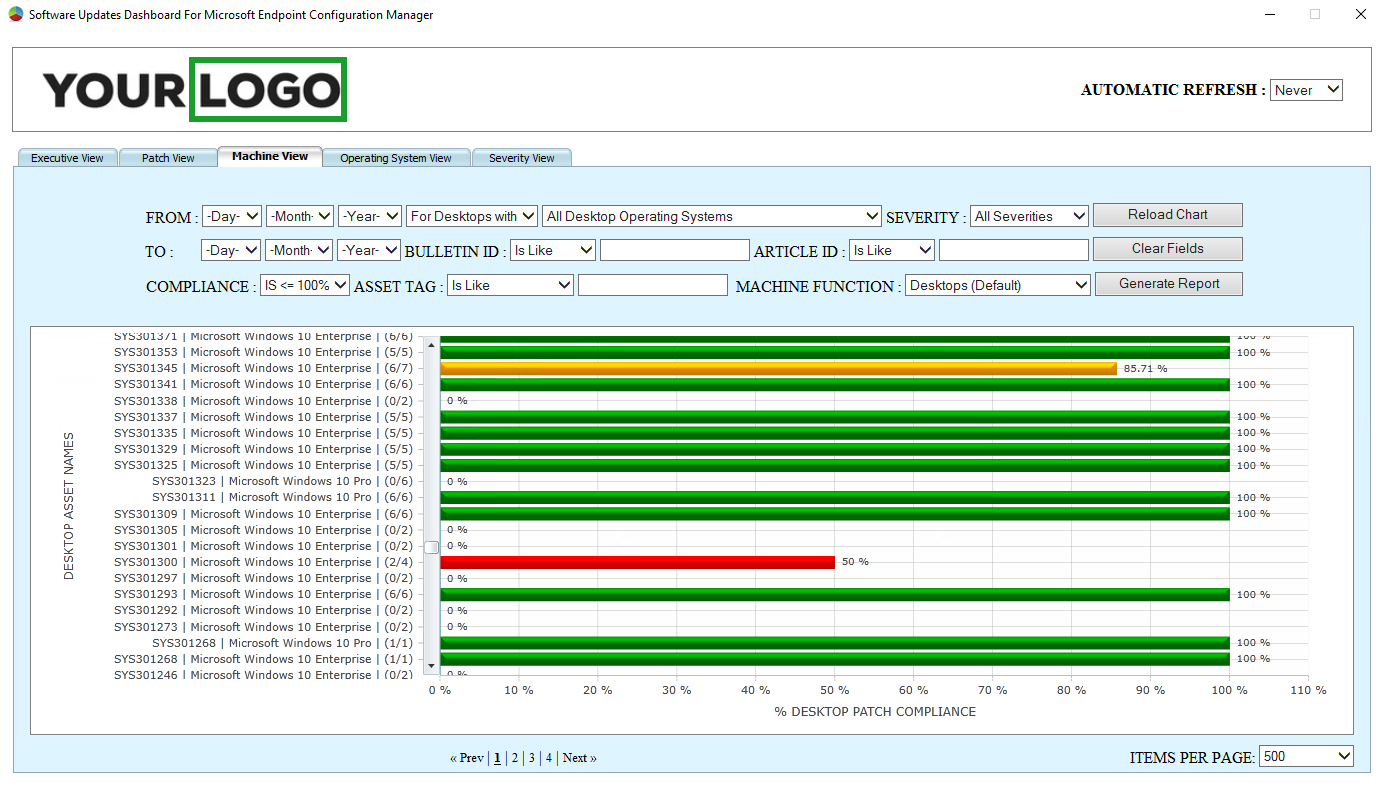
Machine View (4) :
Compliance reporting from the perspective of individual machines. The dashboard also can drill down into each element and list all the compliant and non-compliant security updates.
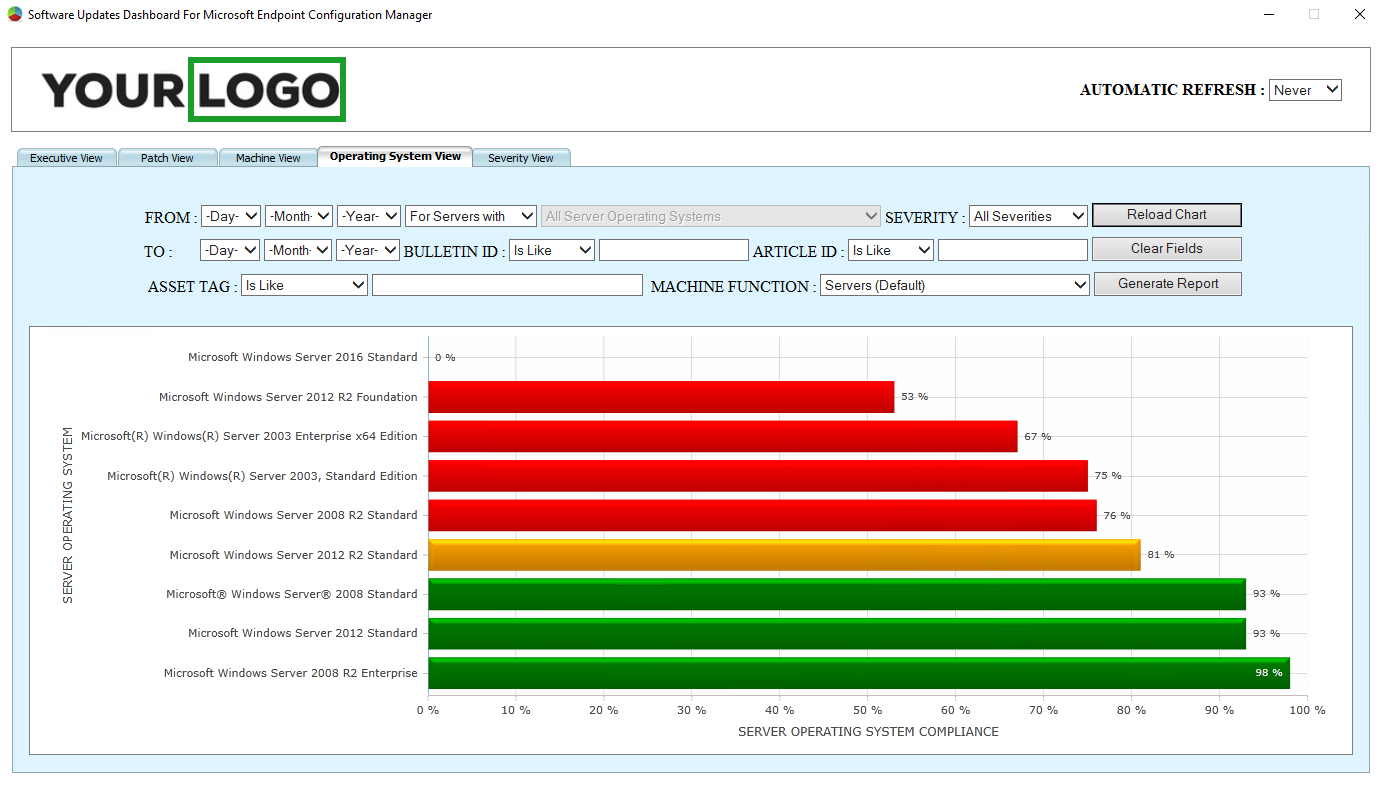
Operating System View (5) :
Compliance reporting based on Window Server and Desktop operating systems. This view helps organisations understand which operating systems are more secure and which aren’t.
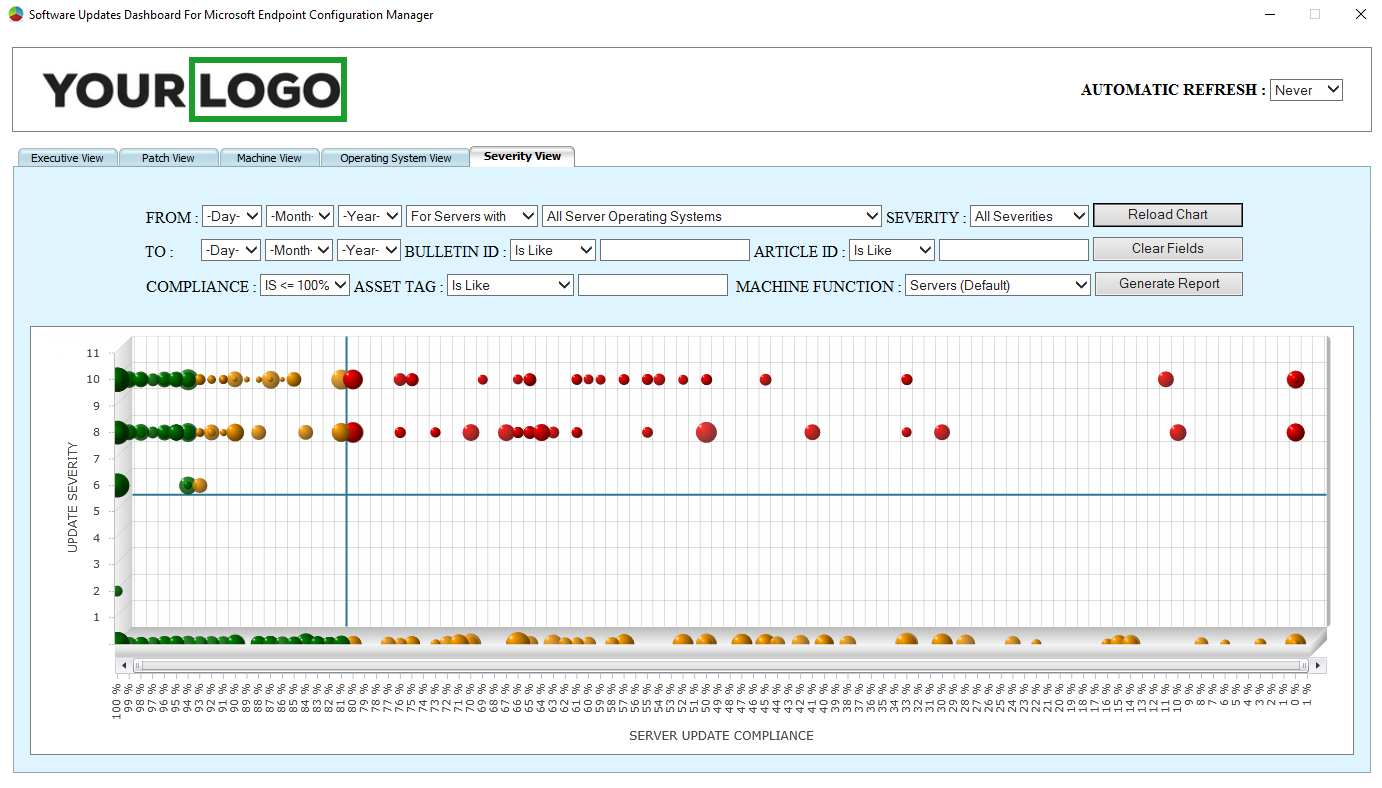
Severity View (6):
This is a view based on the severity of an update on a machine(s). This view hosts 4 quadrants. The elements in the lower left quadrant are updates on devices with a high compliance percentage, but the updates are not very important or severe.
The elements in the upper left quadrant are high-severity security updates with high compliance figures. All green, all safe, all happy.
The elements in the lower right quadrant are low-severity security updates with low or very low compliance percentages. By best practice standards, these need to be addressed promptly but have to be remediated at some point.
Finally, the top rightmost quadrant elements need immediate attention and a quick response from you. These are high-severity security updates, and the compliance for those security updates is either low or very low.
The bigger the bubble, the longer the update(s) have been around. The bigger bubble updates need to be applied immediately.
Software Update list:
This is a list against which compliance is measured. Servers and workstations can be measured against one or more Software update lists.
Server compliance is evaluated against Software Update lists that begin with ‘DASHBOARD-SERVER-‘
Workstation compliance is evaluated against Software Update lists that begin with ‘DASHBOARD-DESKTOP-‘
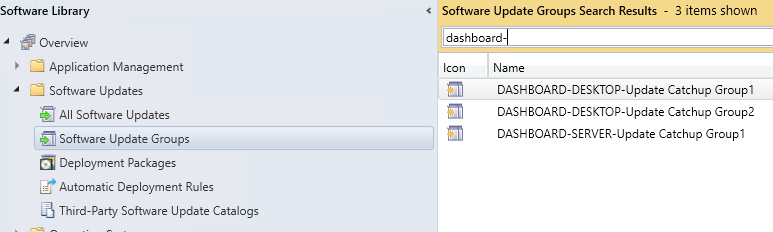
!! ATTENTION !! An update can only appear once (1 time) in all of the Software Updates Lists. If an update appears multiple times, the dashboard statistics will be incorrect.
What’s in the downloaded ZIP File?
The dashboard is a collection of files extracted from the downloaded ZIP file.
The ZIP file contains multiple files, most of which do not have to be edited. The files to be edited/replaced are the ‘configuration.js‘ file, a javascript file, the ‘logo.png‘ file and the ‘SCCMSUdashboard.exe‘, the dashboard.
The dashboard: This is a C# application that runs an HTML file inside a web browser control. The HTML file uses Silverlight libraries to render the Charts. Use the executable file ‘Silverlight_x64.exe to install Silverlight before using the dashboard. Before launching the dashboard, ensure you complete all the required settings in the ‘configuration.js‘ file. The dashboard requires a direct connection to the SCCM SQL database. The dashboard user requires at least read access with the ‘Select’ permissions.
The logo file: This is a PNG file. The height of the image has to be less than 70px, and the width has to be less than 310px.
Configuration JavaScript file: This contains crucial information that drives the dashboard. Only 6 of the settings in the configuration file have to be changed.

Important configuration file attributes:
Customer name <customername>: Name of the Customer/Client within single quotes. It should not be greater than 20 characters long.
Environment name <openv>: Name of the environment within single quotes. It should not be greater than 20 characters long without any spaces.
SCCM SQL Server name <sqlservername>: FQDN of the SCCM SQL Server with or without the instance.
Database name <dbname>: Name of the SCCM database. Usually called sms_<sitename>
Default Collection for Servers <serverdefaultcollectionid>: This will be the collectionID of the collection containing all Servers.
Default Collection for Workstations <desktopdefaultcollectionid>: This will be the collectionID of the collection that contains all Workstation devices.
There are other attributes in the configuration file that can be optionally changed. Information governing those attributes is available as a comment in the ‘configuration.js‘ file. Displayed below is an example of the ‘configuration.js‘ file.
						var vardef = {
		defaults: {

	//EDITABLE Configuration Items ************************************************************************************
				//Customer Name or Client Name
				customername: 'customername',

				//Operating Environment e.g. Production, Test, Development etc
				openv: 'PROD',

				//The SCCM CENTRAL DATABASE Server Name. Need not be the SMS provider server.. Server where the DATABASE is hosted.
				//For Microsft SQL server Express append \\SQLEXPRESS after the server name(IPAddress)...
				sqlservername: 'sccmsqlserver.demodomain.local',

				// the CENTRAL DATABASE name of the SCCM infrastructure. e.g. sms_<sitename>.
				dbname: 'CM_PR1',

				//Default SERVER COLLECTION which the charts will load during start-up - can be changed after start-up.
				serverdefaultcollectionid: 'PR1000BA',

				//Default Desktop COLLECTION which the charts will load during start-up - can be changed after start-up.
				desktopdefaultcollectionid: 'PR1000BC',

				//default number of pages to load (servers) in the Server and Desktop - Patch View.
				//Mulitiples of of 50
				SDPVitemstoloadserver: 50,  //WARNING: Should not exceed 3000

				//default number of pages to load (Desktops) in the Server and Desktop - Patch View.
				//Mulitiples of of 50
				SDPVitemstoloaddesktop: 50,  //WARNING: Should not exceed 3000

				//default number of pages to load (servers) in the Patch Compliance - Server and Desktop View.
				//Mulitiples of of 100
				PCDSVitemstoloadserver: 500,  //WARNING: Should not exceed 3000

				//default number of pages to load (Desktops) in the Patch Compliance - Server and Desktop View.
				//Mulitiples of of 100
				PCDSVitemstoloaddesktop: 500,  //WARNING: Should not exceed 3000

				//This value measures the rate of server software update deployment within a set number of days.
				serverupdateinstallratemaxdays: 40, //WARNING: Should not exceed 360

				//This value measures the rate of desktop software update deployment within a set number of days.
				desktopupdateinstallratemaxdays: 40, //WARNING: Should not exceed 360

				//Criticallity of a senario - Patch, device or anything else displayed as a %.
				markasgreen: 93,
				markasorange: 80,
				markasred: 0, //donot change

				//Which of the patches should be marked as NEW. Patches which are how many days OLD?.
				ageofpatch: 0,

				//The below setting sets Animation to TRUE or FALSE
				animationenabled: 'true',

				//NON EDITABLE Configuration Items *******************************************************************************

				// WARNING -- the below configuration items determines the loading times and when the charts initiate. Changing this will cause the application to mal-function.
				SDPVfirstload: true, //donot change.
				PCDSVfirstload: true, //donot change.
				OSCVfirstload: true, //donot change.
				PCMVfirstload: true, //donot change.
				PCSEVVfirstload: true, //donot change.
				selectedtab: "tab1", //donot change.
				inited: true //donot change.
		}
	}
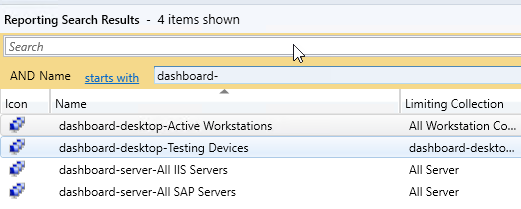
Machine Function:
These are collections of either Server or Workstation devices. These collections help display compliance information for a small subset of devices.
The machine function for the Servers starts with ‘DASHBOARD-SERVER-‘
The machine function for the Workstations starts with ‘DASHBOARD-DESKTOP-‘